excel courses
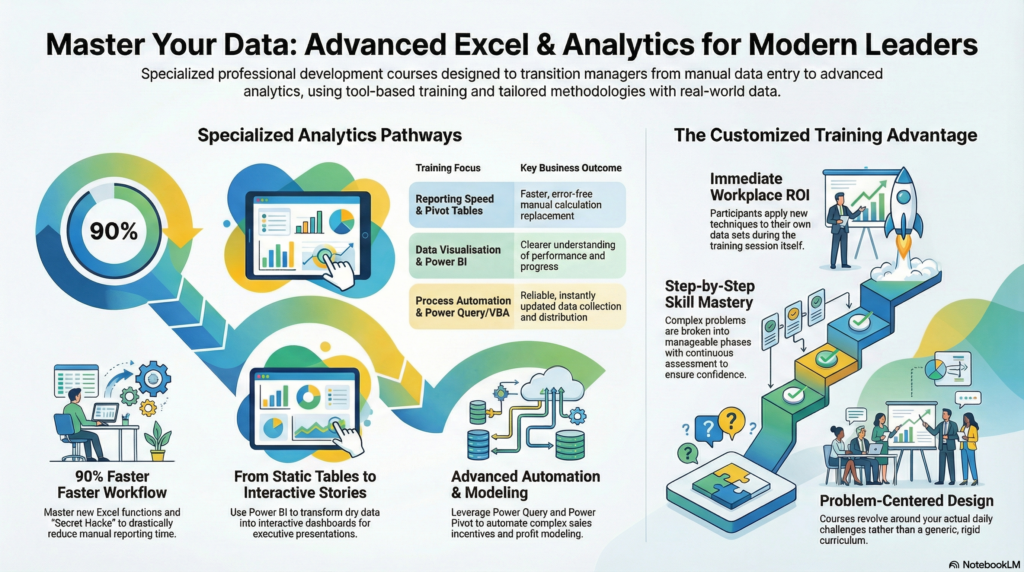
Master Your Data: Advanced Excel & Analytics for Modern Leaders
Hidden Secrets of Data Analysis in Excel

This course is specially designed to help executives and managers who are currently preparing their reports using manual calculations, auto-filter, and wish to learn how to prepare and analyze their reports faster using Pivot Table, one of the best tools hidden in Excel.
At the end of the course, they will be able to skillfully create and design their reports using worksheet functions, Pivot Tables, Pivot Charts, and Dashboards.
The skills acquired mark the start of their journey in Data Analytics, a capability that many companies hope to build for the digital economy. Learn More
Secret Hacks of Excel Data Analytics for PMET

This course is an upgrade from Hidden Secrets of Data Analysis in Excel. The course will train you on the new Data Analytics functions added recently to Microsoft Excel and show you how to make use of them effectively for Data Analytics.
At the end of the course, you will be able to confidently apply data analytics skills to your job and add value to your organization. At the same time, you will be the first to learn how to use the new functions in Excel to work 90% faster. Learn more.
Power BI for Executives & Managers

Power BI is a data visualization tool for analyzing and presenting performance and progress updates effectively to management as compared to simple static tables of numbers. With Power BI, you can create an interactive dashboard to gain a better understanding of the data you own.
At the end of the course, they will be able to create an interactive dashboard for reporting and presentation and tell a story using the visuals created. Learn More
Automate Sales Incentive Calculation with Excel Power Query and Power Pivot

This course is suitable for Finance, HR, admin, and Sales Admin professionals who are involved in complicated sales incentive calculations involving different commission levels for brands, locations, and quarterly targets.
At the end of the course, you will be able to make use of different elements in Power Query, compare the sales between months or years using Power Pivot, distribute the sales incentive between salespersons and present the different sales incentives by salesperson. Learn more
Grow Your Profit Through Data Analytics and Data Modelling
This course is specially designed to help executives and managers who already know Pivot Table and feel that they are not proficient with it yet. In this course, we will reveal the secret of creating highly efficient Pivot Tables that are instantly updated month after month.
At the end of the course, they will be able to use Pivot Table to compare 2 sets of values, calculate growth/variance within Pivot Table, and learn how to make use of the Power functions in Excel, namely Power Query, Power Pivot.
The skills acquired help you navigate the different capabilities of Data Analytics and prepare you for the new data-driven economy. Learn More
Productivity Boost: Top 50 Excel Tips and Tricks
This course is for existing Excel users who are seeking shortcuts and tricks to speed up what they have already done. The tips and tricks are easy to pick up and make working with Excel simple.
At the end of the course, they will be able to immediately apply these tricks back at work. There is no macros/VBA/programming involved in these tips and tricks. Learn More
Leveraging Power Query, Data Model and Power Pivot

This program is a deep dive into advanced Pivot Table by Microsoft. In this course, you will learn all the essential DAX functions to help you create the most robust and instantly updated dashboard.
With PowerPivot, creating calculations within Pivot Table is no longer a wishlist. You can now compare 2 different sets of numbers, show the differences, find percentages based on the full total, calculate YTD, with a click of the button. Learn More
Learning the Magic of Macros (VBA)

Learning the Magic of Macros is a coaching program designed to help business professionals automate their data collection and distribution activities. The main objective is to create highly accurate and reliable data sources for reporting. Through the program, the participants are coached to create their own macros that they can customize and use immediately upon completion. Learn More
Customized Excel Course
When it comes to mastering Data Analytics tools such as Excel, Power BI, and others, one-size-fits-all training programs often fall short. That’s why we’ve developed a highly customized approach to Excel training that is designed to meet your specific needs and ensure you gain the skills you actually use in your day-to-day work. Here’s how our tailored training approach can make a significant difference for you:
1. Understanding Your Day-to-Day Needs
Before the course even begins, we take the time to understand what you do on a daily basis. You’ll have the opportunity to share the tasks you regularly perform and identify functions you believe could make your job more efficient. This allows us to design a course that is directly relevant to your work, ensuring that every moment spent in training is valuable and applicable.
In our training for a group of procurement and supply chain specialists, the participants submitted their day-to-day Excel work for review. During the review, we will identify the optimal solution for the team’s problems. For example, the team shared with us how they made use of their forecasting file for production planning, highlighting the need to constantly toggle between their worksheets when they review their products.

2. Solving Your Real-World Problems
Instead of following a generic curriculum, our course revolves around the actual challenges you face in your role. We focus on the specific problems you need to solve, guiding you through the exact functions and techniques that will help you overcome these obstacles. This problem-centered design ensures that what you learn is not just theory, but practical skills that you can immediately apply to your work.
In one of our customized Excel courses, the participants had to consolidate multiple product forecast files and estimate the materials demand from all the consolidated products. Their existing practice was to copy and paste the product forecast into one Excel worksheet, manually calculating the demand for each material. They did not think that the Pivot Table could be used for this exercise. In the course, we recommended the use of Power Query for the product forecast consolidation and Pivot Table to summarize the material demand based on the product forecast. Unknown to the participants, the secret lies in the organization of the product forecast.
3. Continuous Skill Evaluation
During the course, we constantly assess your understanding and skills. This ongoing evaluation allows us to tailor the training to your pace and needs, making sure you grasp each concept fully before moving on. This way, you won’t just learn how to use Excel—you’ll master it in a way that makes sense to you.
In the course, we will identify those who may not have used Pivot Table before and start with a simple data set for the Pivot Table. When everyone has acquired an understand of how Pivot Table works, we will proceed to a more complex data set. In the process, we may use the data set they have supplied so that they can compare the difference between using a Pivot Table and one without.
4. Step-by-Step Learning
Complex problems can be overwhelming, but we break them down into manageable steps. We guide you through each part of the problem, teaching you how to use Excel functions effectively in each stage. This step-by-step approach not only helps you understand each function in isolation but also how to string them together to solve larger problems.
Instead of showing our participants the solution straight away, we break down the solution into multiple steps to show them how it is done. We do not show our participants how to consolidate and clean up the data all at go. Instead, we use the data set to show the consolidation phase first. In the second exercise, we will ask them to repeat the consolidation on their own and add more steps to complete the solution in the second, sometimes third exercise.
5. Flexible and Adaptive Curriculum
Our course isn’t rigid. It evolves based on the questions you ask and the challenges you encounter. If you face a new problem at work, we’ll adjust the course to include the tools and techniques needed to solve it. This flexibility ensures that the training remains relevant and directly addresses your current needs.
The Benefits of a Customized Data Analytics Course
- Relevance to Your Work: Every part of the course is tailored to what you do, ensuring that what you learn is immediately applicable.
- Problem-Solving Skills: You’ll learn not just how to use Excel, but how to approach and solve real-world problems using Excel.
- Confidence in Your Skills: Continuous assessment and a step-by-step approach ensure you build confidence in your ability to use Excel effectively.
- Efficiency Gains: The practical skills you acquire will directly improve your efficiency, saving you time and effort in your daily tasks.
Why Choose Customized Excel Training?
Generic courses might teach you the basics, but our customized Excel training ensures you gain the exact skills you need to excel in your role. By focusing on your specific challenges and needs, we make sure that every part of the training is relevant, practical, and immediately useful.
Ready to transform the way you work with Excel? Contact us today to learn more about our customized Excel courses and how they can help you achieve your professional goals. If you still prefer a more generic training, check out the courses below.