reporting struggle
How Excel Training Turned Keith’s Reporting Struggle into Success
Keith had a routine. Every quarter, he would download the same report — a detailed overview of his department’s expenses, which was part of a broader company report designed for all departments. It wasn’t fancy, but it worked, and for a while, it provided everything his team needed to stay within budget. Keith would use the report to track costs, see where the money went, and how it was allocated between the departments. It felt manageable, organized, and useful.

But as business grew, the complexity grew with it. One day, Keith’s boss, Samantha, approached him with a new request. “Keith,” she said, “I’d like to know the actual cost of each expense item before we allocate the expenses. I need it to understand where our spending is coming from and how we can optimize it.”
Keith, a diligent employee, agreed without hesitation. It seemed simple enough. The numbers were already there in his quarterly report, but Samantha wanted a deeper look at the original invoice costs before the departmental allocation took place.
Keith went straight to the IT department, confident that they could provide him with the data he needed. However, when he explained his requirements, he hit an unexpected roadblock. IT replied with a regretful shake of the head. The system, they said, didn’t keep the original invoice details once they were processed. “Due to system constraints, we can’t retrieve the original invoices,” they told Keith. The data was simply purged after allocation, leaving him with only the processed numbers.
Keith felt his heart sink. Without those original details, how could he give Samantha the breakdown she needed? The pressure began to mount. Samantha was counting on him, and he hated to disappoint her.
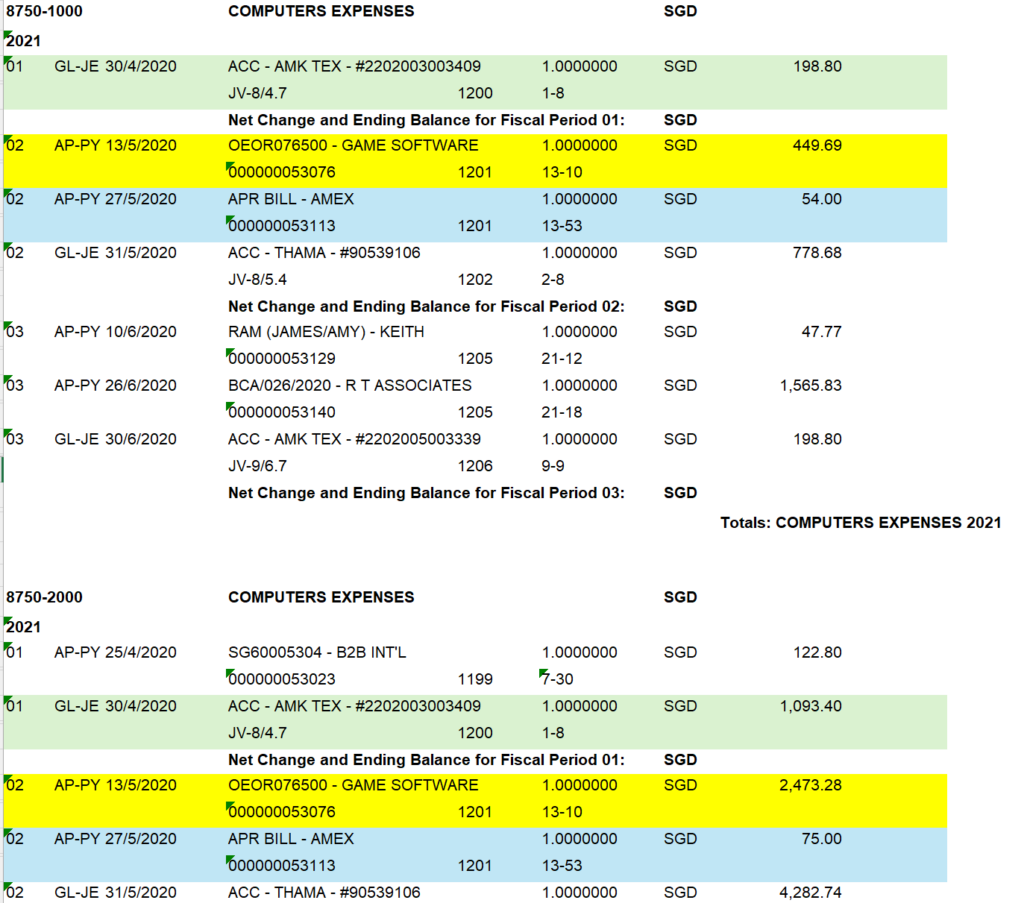
With no other choice, Keith sat back down at his desk, staring at the report. It had layers of data, totals, and allocations—but it was like looking at a complicated puzzle without any instructions. He felt stuck. The report, once his ally, now seemed like a stubborn adversary. He needed to reverse-engineer the allocated numbers to find the original values, and there was nothing straightforward about that.
Keith spent hours trying to piece together what was hidden. He used guesswork, tracing calculations backward, and attempting various Excel formulas that he remembered from his self-taught sessions. There were SUMs, IFs, VLOOKUPs, even some pivot tables—but none of it gave him what he needed. He felt overwhelmed.
The Transformation: Learning Excel Analytics
Around that time, Keith heard about a customized Excel training course offered by the company’s Learning & Development team. Normally, Keith would skip these kinds of training—he considered himself pretty good at Excel already. But this time, the stakes were different. Samantha’s request weighed heavily on his mind, and Keith decided to sign up.
The course was an eye-opener. The instructor walked the class through Excel’s advanced analytics functions—Power Query, Pivot Tables, and even techniques for working with data that was seemingly “locked in place.” The instructor demonstrated how to “unpivot” data that had been summarized, using Power Query to reshape it back into something closer to its original form.
Keith was amazed. He learned about the GETPIVOTDATA function, which allowed him to extract specific values from PivotTables and use them dynamically. He discovered how Power Query could be used to automate steps that he had previously tried to do manually, painstakingly line by line. The mysteries that had seemed impenetrable before were now suddenly solvable.
After the course, Keith felt empowered. He opened up his quarterly report and applied what he had learned. He used Power Query to pull apart the allocations, creating a model that could trace back through the summarized data to approximate the original invoices. He built PivotTables to give Samantha a view of not just the total allocations but also of each item before the allocation process took place. It took time to set up, but once everything was in place, it worked like magic.
Samantha was impressed. The next time she asked about expenses, Keith was ready with a clear report—one that showed not only where costs ended up but also where they started. She praised his efforts, and Keith felt a sense of pride. He had gone from feeling defeated by the limits of the report to mastering it, thanks to the Excel skills he gained.
Question: What skills must Keith have to solve his problems?
Answer: Power Query in Excel, detect patterns in the report, classify data, Pivot Table
Are you facing a problem similar to Keith’s? We have the solution for you. Drop us an email for more details.