excel course
Unleashing the Power of Data Analytics
Explore the challenges presented on this page. Do they resonate with you? If so, you’re on the brink of discovering solutions that promise not just hope, but also the opportunity to save time and streamline your work with unprecedented ease and accuracy. At everydayExcel, we specialize in turning familiar frustrations into victories by unveiling the untapped potential of Data Analytics in your everyday Excel tasks.
Transforming Event Management with Excel and MS Forms
Bee’s approach to event management was transformed entirely. What was once a tedious, time-consuming task became streamlined and efficient. The manual collation of data no longer bogged down bee. Instead, she could focus on more strategic aspects of her role, such as engaging with attendees and improving the overall event experience. The automation of data collection and attendance tracking also meant fewer errors and more reliable data for analysis …more
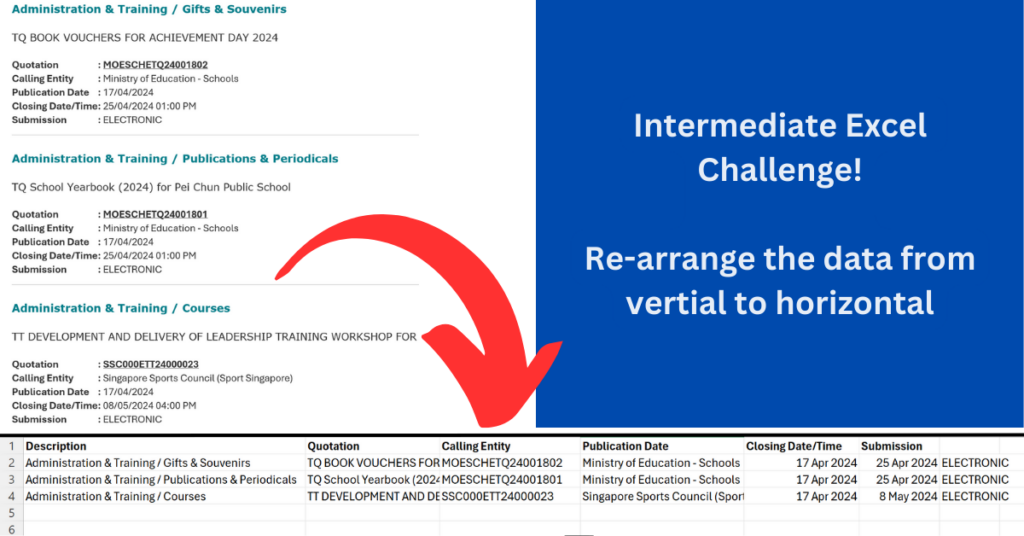
Intermediate Excel Challenge: Are Your Skills Up to the Mark?

In the bustling office of a medium-sized company, Samantha, a diligent executive, faced a recurring challenge that tested her Excel skills daily. Samantha was responsible for managing a list of active tenders, a task crucial for the smooth operation of her department.
Every morning, her inbox would be filled with emails containing details of new tenders. These tenders were listed in a vertical format with each tender’s details stacked one after … read on
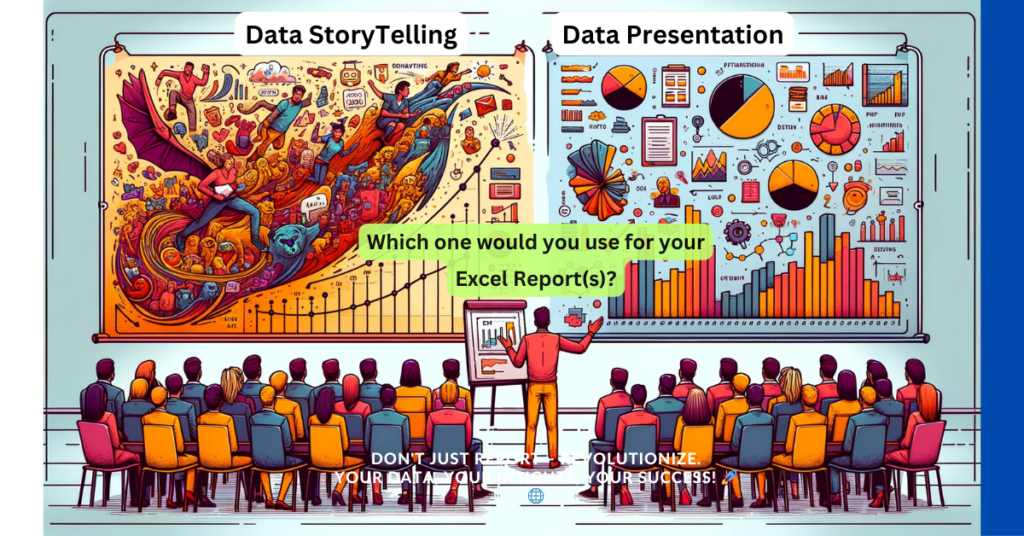
Difference between Data Storytelling and Data Presentation

The distinction between data storytelling and data presentation lies in their approach and purpose, although both play crucial roles in the field of data analysis and communication.
Storytelling and presentations are both powerful communication tools, but they serve different purposes and are delivered in distinct ways. Understanding the difference between the two is crucial for effectively conveying information, engaging an audience, and achieving desired outcomes. Let’s explore the key differences here
What is an intermediate Excel user in Finance capable of?
An intermediate Excel user in the finance field would have a solid understanding of Excel’s core functionalities and be able to apply them to solve complex financial problems and tasks. Here’s a summary of capabilities that typically distinguish an intermediate Excel user in finance:

- Advanced Formulas and Functions
- Data Analysis and Reporting
- Spreadsheet Management
- Charting and Visualization
- Basic Macros and Automation
- Solver and What-If Analysis
An intermediate user is expected to confidently navigate Excel, use its features to create sophisticated financial models, perform complex analyses, and generate insightful reports. This skill set significantly enhances efficiency, accuracy, and decision-making capabilities in financial roles… read on
The Midnight Excel Saga: Overcoming Budget Nightmares

In the heart of the bustling financial quarter, an ordinary Excel user, Alex, found himself embroiled in the chaos of the budgeting season. A season that turned the mundane into madness, the simple spreadsheet into a labyrinth of complexity. This is the tale of endurance, of midnight oil burned, not for ambition, but for the sake of avoiding the specters of errors past.
As the clock struck twelve, marking the boundary between … continue the story
The VLOOKUP Saga of Four Managers and Their Advanced Excel Adventures

The stories of Lucas, Priya, Omar, and Naomi emphasize the importance of going beyond conventional Excel functions like VLOOKUP when faced with complex data challenges. By embracing Excel’s Power Query, INDEX/MATCH, FULL OUTER JOIN capabilities, and the fuzzy lookup add-in, you can navigate through extensive datasets, multifaceted conditions, incomplete records, and partial matches with ease and accuracy. These advanced Excel features open up a world of possibilities for efficient data management and decision-making, proving invaluable in the dynamic environments of event coordination, project management, supply chain analysis, and IT management. continue reading
Vlookup is the not answer – The Tale of Four Managers

Each manager’s journey from confusion to clarity underscores a pivotal Excel lesson: while VLOOKUP has its merits, it’s not a one-size-fits-all solution. By exploring Excel’s vast array of tools like Power Query, INDEX/MATCH, and the fuzzy lookup add-in, you can tackle complex data challenges with precision and efficiency. Whether you’re managing inventories, analyzing marketing data, reconciling employee records, or matching financial transactions, Excel holds the key to transforming data conundrums into insightful decisions. find out more
How a Shoe Company CFO Changed the Game for Store Managers

William, the CFO of a renowned outdoor shoe company, stepped into the meeting room, ready to delve into the progress reports prepared by his store managers. As Daniel, the first manager, concluded his presentation of sales figures via a line chart, William inquired about the noticeable dip in sales for a particular brand from the last quarter. Daniel’s silence spoke volumes; he had no answers. William’s frustration was palpable, especially considering he knew his team had spent the previous night, well into the early hours, manually assembling these reports.
The endeavor to seek a more efficient method had led … read on
Transforming Financial Reporting with Data Storytelling

Data storytelling, Sharon learned, was not about altering the data or making it more complex, but about presenting it in a way that wove the numbers into a compelling narrative. It was about context, about painting a picture that highlighted not just the what, but the why and the how of the financial figures. This approach aimed to engage the audience emotionally and intellectually, making the data relatable and its impact clear. Learn more
Unlocking the Power of Data Storytelling in Procurement

Through data storytelling, Rebecca not only redefined her role as a procurement manager but also enhanced the way her team interacted with data. They were no longer just looking at numbers; they were reading a story—a story of their collective effort, challenges, and successes. This shift didn’t just change the way they viewed reports; it changed how they approached their work, making every number, every graph, a page in their ongoing story of striving for excellence. Learn More
A Strategy for Meaningful Analysis in Crime Reform
Jessica worked for the youth crime reform unit, a place where the paths of many troubled youths were redirected towards brighter futures. In her role, Jessica had a significant responsibility: tracking the progress and outcomes of youth offenders who participated in reform programs. To do this, she utilized a tool familiar to many: Excel. Jessica meticulously entered details of each youth offender and the specifics of their engagement in various programs into sprawling spreadsheets.
However, when the time came to assess… more
The Critical Piece Missing in Your Training
As the training manager of your company, you play a crucial role in connecting your team with the necessary skills and knowledge to excel. Your responsibilities include assessing training needs, exploring new courses, and evaluating the impact of these programs on performance and productivity. Recently, you have focused on enhancing the team’s proficiency in Excel due to its vital role in data management and analysis across departments. Despite the Excel training your team has received, there remains a noticeable… more.
7 Reasons why Excel is better than SaaS (Software as a Subscription)
Discover the compelling reasons why Excel surpasses SaaS (Software as a Service) in business applications on “Excel vs SaaS – Mastering Data for Business.” This insightful comparison emphasizes Excel’s customization, versatility, cost-effectiveness, and minimal IT support needs, among others. Ideal for businesses seeking a powerful, adaptable tool for data analysis and management. Dive into the advantages that make Excel an indispensable asset for strategic insights and growth. Read the full exploration here.
Harness the Full Potential of Your Training Data with Pivot Tables:
A Must-Read for L&D Professionals!
Transform the way your organization manages training data with the power of Pivot Tables. This compelling article showcases the journey of a training manager, Alex, who overcomes the challenges of manually updating Excel sheets for employee test scores. Discover how Pivot Tables revolutionize this process, enabling dynamic summarization, automated insights, and empowering employees with immediate feedback. Dive into a story of efficiency, strategic focus, and employee growth, highlighting the invaluable benefits of embracing technology in training and development. Read more about this transformative approach here.
