master excel data analytics
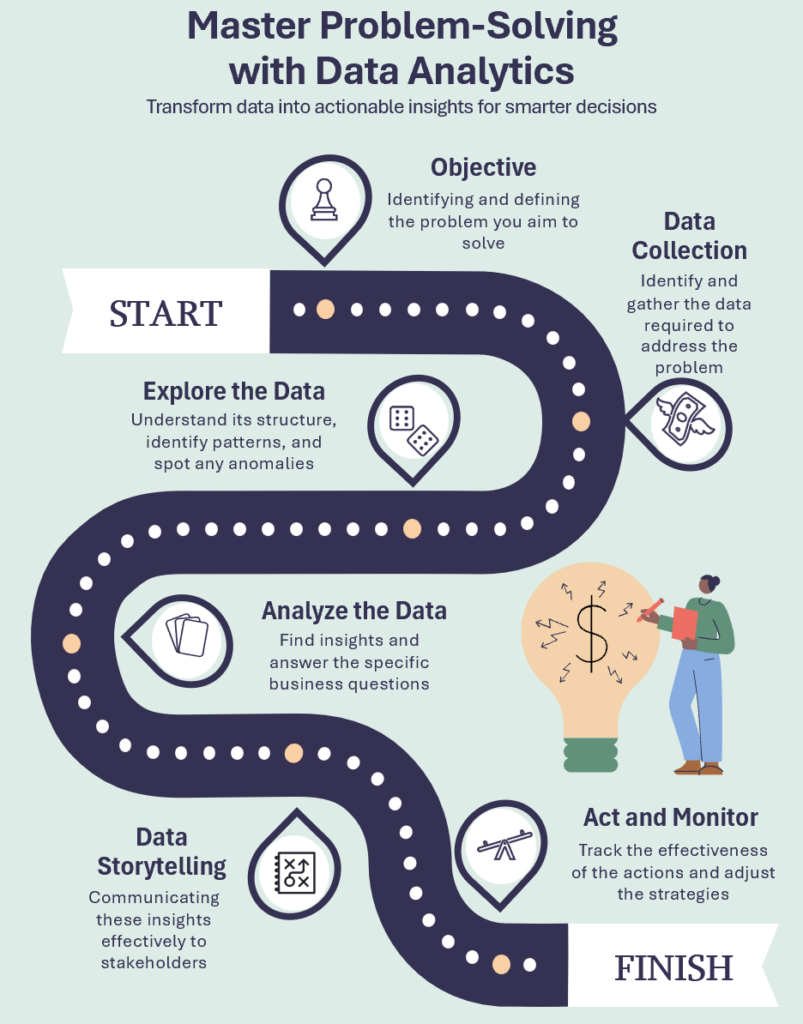
Master Problem-Solving with Data Analytics
Course Overview
This comprehensive course equips participants with the skills to navigate the 7-stages of Problem-Solving effectively, utilizing cutting-edge tools such as Power Apps, Power Automate, Excel and Power BI. Through hands-on exercises and real-world examples, you’ll learn to harness data analytics techniques to uncover insights, propose actionable solutions, and drive successful implementation and evaluation.
Learning Objectives: By the end of this course, participants will be able to:
- Develop a structured approach to problem-solving using data.
- Master Excel’s powerful analytics tools and Power BI Dashboard Reports
- Gain the confidence to make data-driven decisions.
- Enhance your professional value with hands-on skills.
Who should attend:
- Managers, team leads, and decision-makers who need data-driven strategies to solve operational challenges.
- Project Managers who need to identify, analyze, and solve problems efficiently using data
- Teams working in finance, logistics, or operations seeking to optimize processes and improve outcomes with data insights.
I have always been clueless about the power of Excel, doing many things the manual way like counting amount in cells and doing manual layouts. To me Excel has always been just another program I layout my reports with. But after attending this Excel course, I realised that there is so much more power stored in Excel to help enhance and make efficient daily work reports that I have to do especially with ensuring accurate details in figures in big amounts. I’m sure as I continue to explore what has been taught, I will be able to save alot more time and stop pulling my hair out while I face my reports again.
Rachelle (Medical), Johnson & Johnson Pte Ltd
Course Outline:
Module 1: Foundations of Data Analytics for Business Success (1 Day)
Topic 1: Data Analytics and Business
- What is Data Analytics
- Why is it important for business
- 4 types of Data Analytics
Topic 2: Applications of Data Analytics:
- COVID-19 Management Around the World
- The impact of data analytics in other industries
- Organizations that use data analytics to improve their performance
Topic 3: The Data Analytics Value Chain
- 6 Stages of the Data Analytics in Problem Solving
- The tools and technologies used in Data Analytics
Topic 4: Data Analytics Culture
- Building Data Analytics culture in a team
Module 2: Unleash the Power of Microsoft Excel (2 Day)
Topic 1: Data Analytics and Excel
- Why need Data Analytics in Excel
- Using Pivot Table to generate Trend Report
- Using Pivot Table for risk assessment
Topic 2: Transform Data using Excel Power Query
- Extract data and basic cleansing
- Combining 2 sets of data using Merge Query
- Combining 2 sets of data using append query
- Combining multiple sets of data using Get Data from Folder
Topic 3: Introduction Of Power Pivot
- Compare performance between 2 periods in Power Pivot
- Compare performance between Actual and Budget
- Introduction to DAX
- Introduction to Date Table
Module 3: Data Storytelling with Power BI (2 Day)
Topic 1: Create the basic Power BI Report
- Load Data into Power
- Create Simple Visuals in Power BI
- Navigating Power BI for data storytelling
Topic 2: Clean, Transform and Load data in Power BI
- Loading different Data Sources into Power BI
- Cleaning imported data in Power Query
- Transforming imported data for reporting
- Merging data sources into one
Topic 3: Design a semantic model in Power BI
- Create relationships between Tables
- Create Hierarchy
- Grouping fields
- Number Formatting
Topic 4: Use of DAX
- Create a Table in Power BI
- Create calculated columns
- Advanced DAX functions
- Create a YTD measure
Topic 5: Design Power BI Report
- Create Visuals in Power BI report
- Publish Report
- Create Drill Through Page
Date: 30 Jun – 04 July 2025 (Mon – Fri)
Duration: 5 Days, 9 am to 5 pm
•Mode of Delivery: Face to Face workshop
Location: Hotel