pivot table masterclass
Excel Pivot Table Masterclass: Excel Reporting & Dashboards

Who Should Attend
The training is specially designed for managers and executives who want to summarize and present their data in a dashboard.
Participants must
• Have experience using a pivot table
• own a worksheet of data with at least 50 rows
Learning Objectives
Upon completion of the course, participants will be able to:
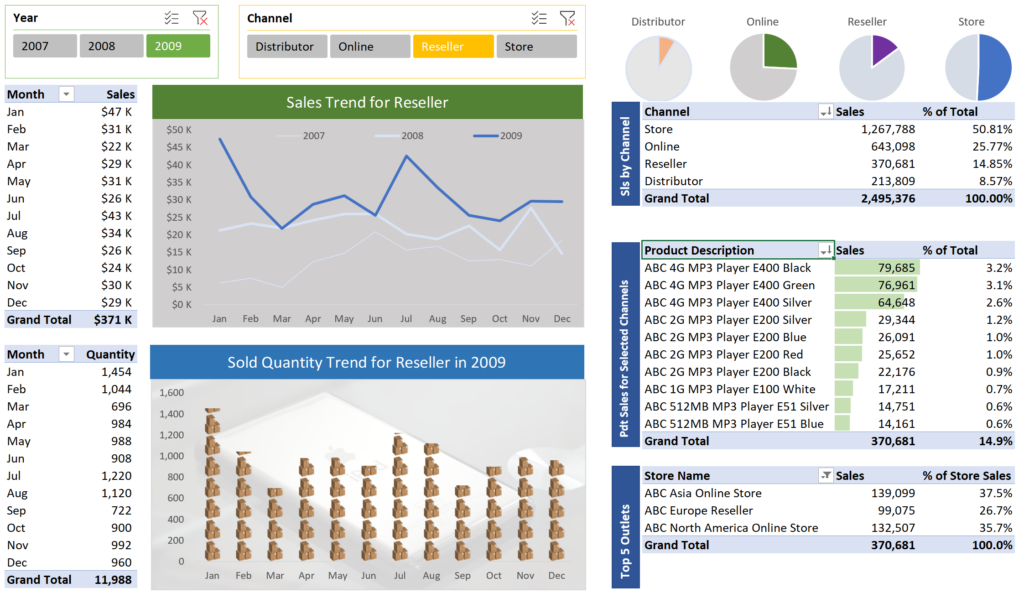
- Designing a dashboard using the functions in Pivot Table and Power Pivot
- Data visualization using Pivot Chart and Conditional Formatting
- Effective use of the functions in Pivot Table and Chart
Course Outline
Pivot Table Compliant Data Set
- Required Data Layout
- 3 ways to connect to your data sources
- Have your pivot table data layout reviewed
Analyze and Summarize your data with Pivot Table
- Create a Pivot Table using Tables
- Create a Pivot Table using a CSV file
- Create a Pivot Table using the files in a folder
- Using more than one summation value in Pivot Table
- Changing Summary Calculations
- Sorting Data in Pivot Table
- Filtering Data in Pivot Table
- Grouping values in Pivot Table
- Grouping dates in Pivot Table
- Counting unique records
- Add and use Slicers for presentation
- Using a timeline in Pivot Table
- Creating trend in Pivot Chart
Mastering the presentation of data
- Creating a bar chart in Pivot Table
- Controlling more than one Pivot Table with slicers
- Attract your audience with professional-looking pivot charts
- Effective use of visuals to attract attention.
Special Bonus
The trainer provides free consultation during the course so that participants can get a head start and apply what they learned immediately to their jobs. Participants need to provide a copy of their sanitized raw data for this.
Program Dates
- 13-Feb-23 (Mon)
- 5-May-23 (Fri)
- 19-Jul-23 (Wed)
- 13-Oct-23 (Fri)
Duration
1 days – 9am to 5pm
Price
S$450 per pax
________________________
If you need further clarifications, please send us a message using the form here and we will reply you ASAP.
